> ## Documentation Index
> Fetch the complete documentation index at: https://docs.safidata.com/llms.txt
> Use this file to discover all available pages before exploring further.
# Question & Objectives Analysis
> Explore aggregated insights across your questions and research objectives.
 ## Overview
The Question & Objectives Analysis view gives you a structured summary of what your respondents said, organized by the questions you asked and (if you set them up) the objectives behind them.
***
## How It's Organized
Results are presented in two ways:
### By Question
Every question in your survey appears with:
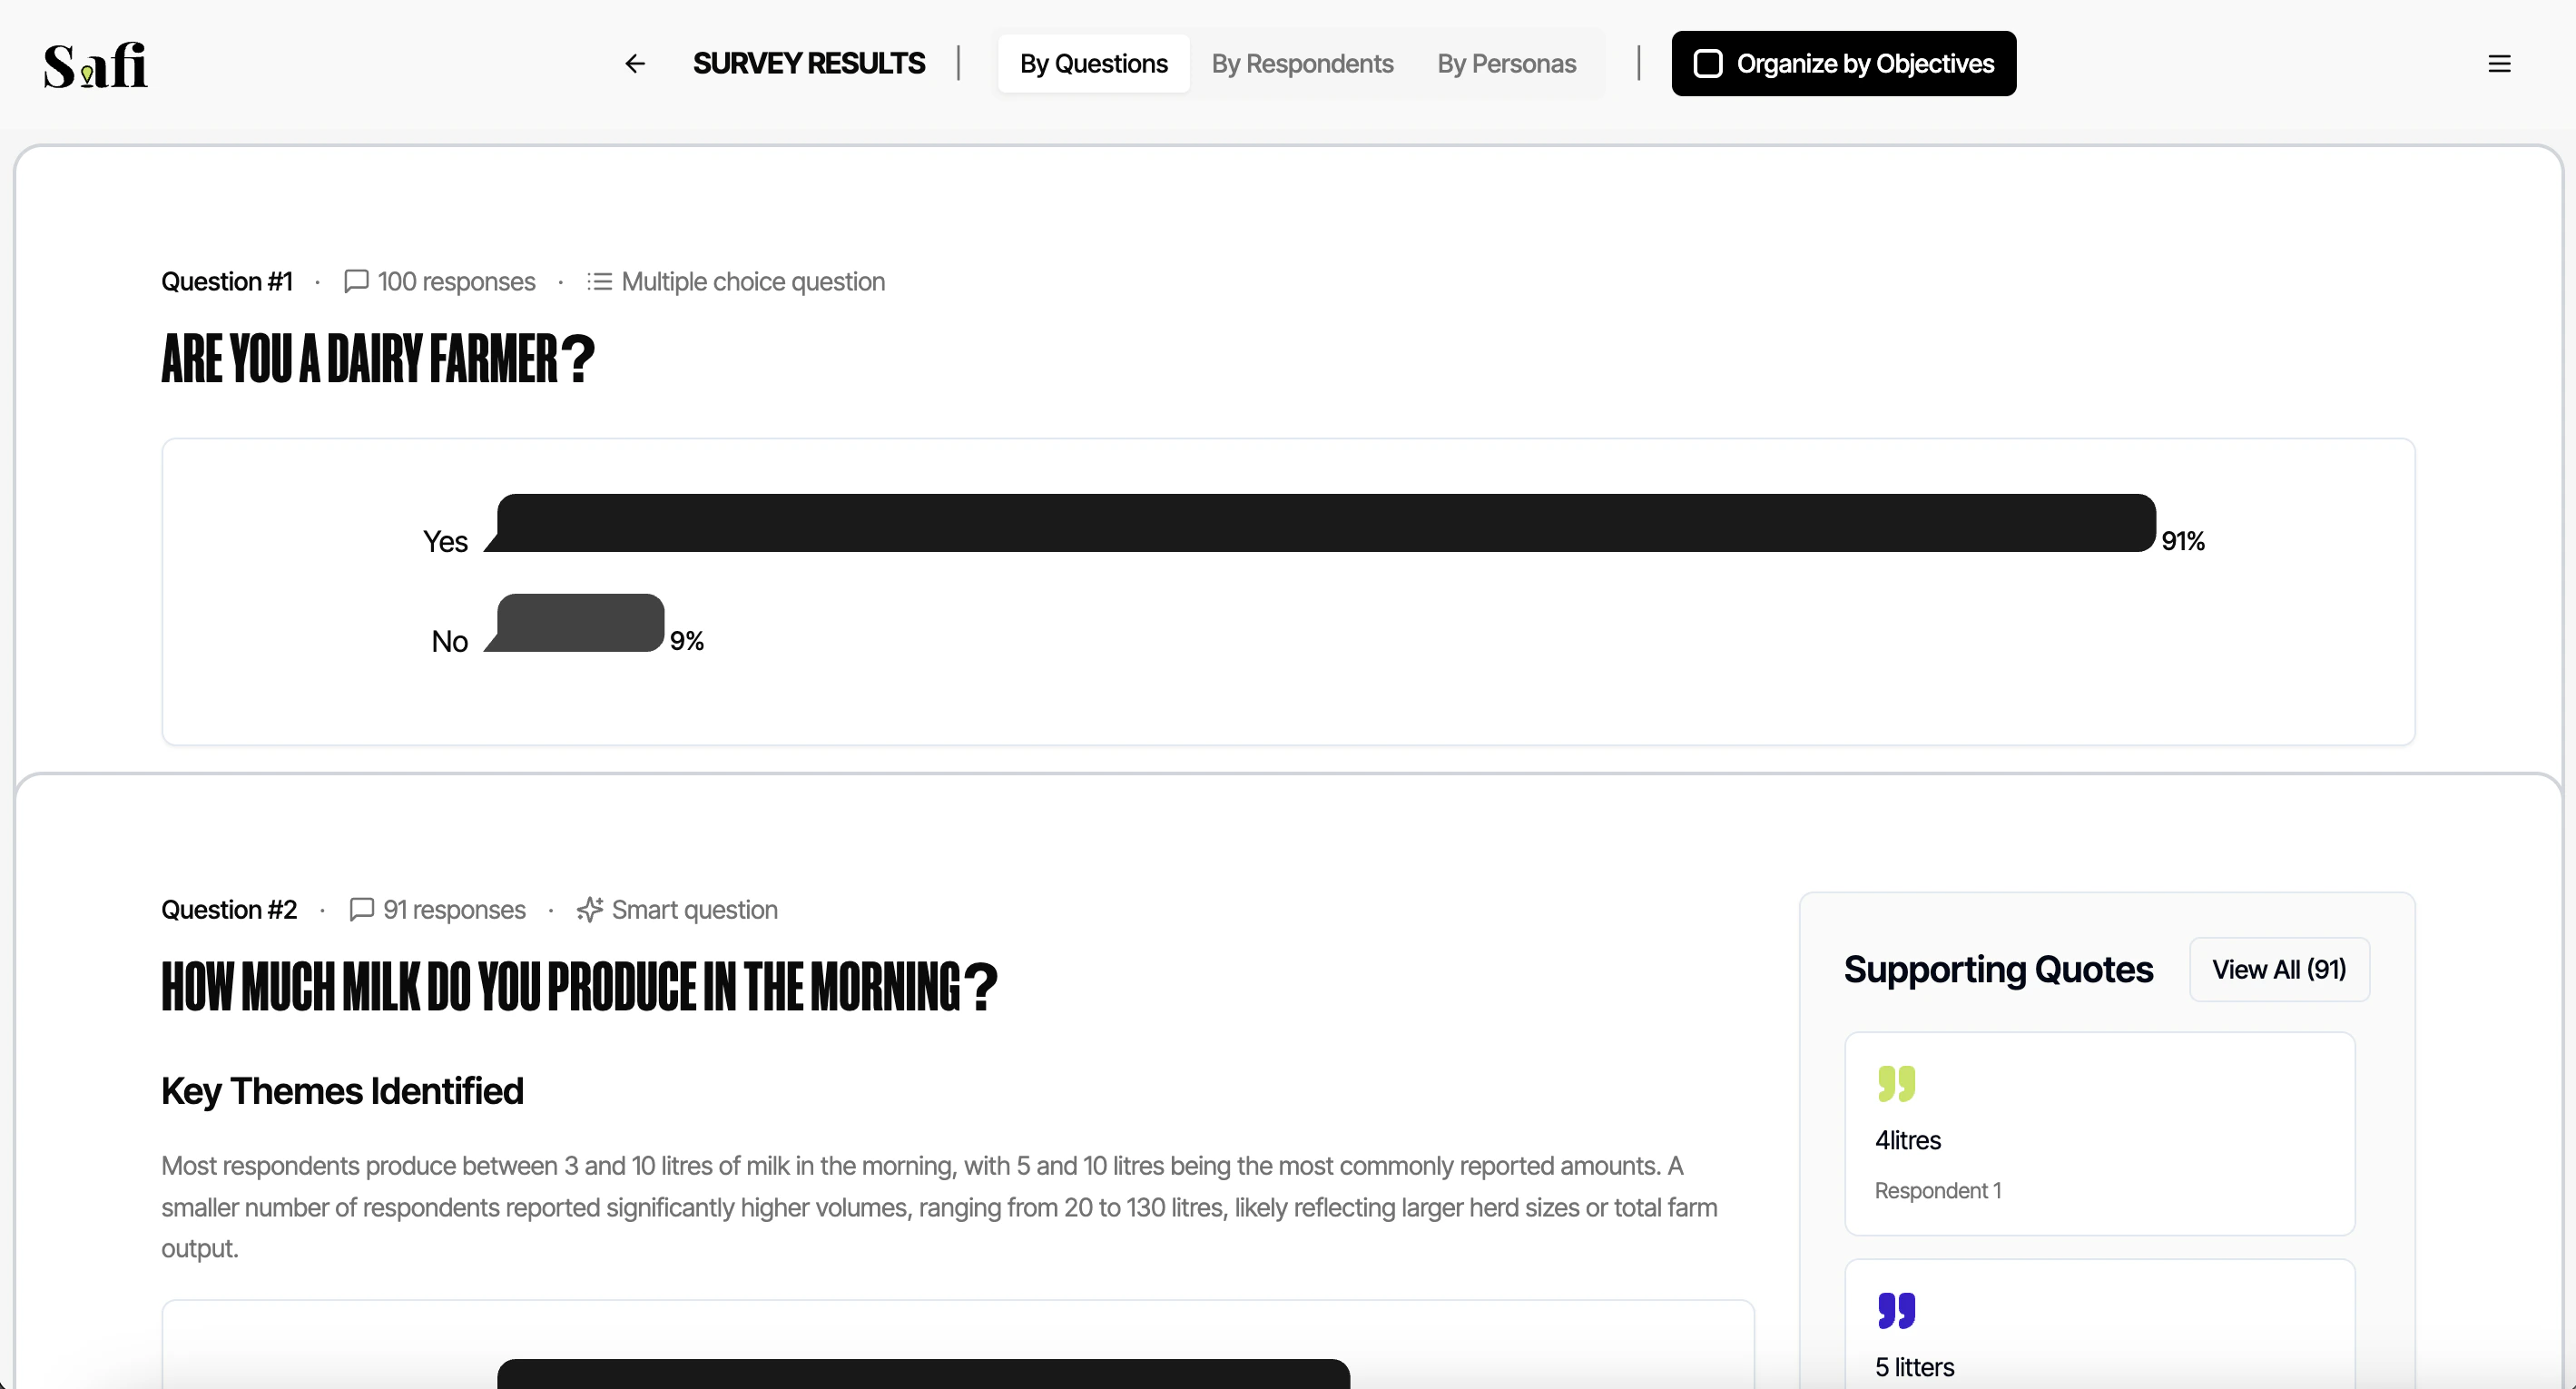
* **A summary** — a short AI-generated paragraph describing the overall sentiment and key themes from responses
* **Key themes** — the most common ideas, opinions, or topics that came up across all answers organized in a bar chart
* **Standout quotes** — notable individual responses selected by the AI to illustrate the themes
For Multiple Choice questions, you will see:
* **A bar chart** showing the distribution of answers
* **Percentage breakdowns** per option
### By Objective
## Overview
The Question & Objectives Analysis view gives you a structured summary of what your respondents said, organized by the questions you asked and (if you set them up) the objectives behind them.
***
## How It's Organized
Results are presented in two ways:
### By Question
Every question in your survey appears with:
* **A summary** — a short AI-generated paragraph describing the overall sentiment and key themes from responses
* **Key themes** — the most common ideas, opinions, or topics that came up across all answers organized in a bar chart
* **Standout quotes** — notable individual responses selected by the AI to illustrate the themes
For Multiple Choice questions, you will see:
* **A bar chart** showing the distribution of answers
* **Percentage breakdowns** per option
### By Objective
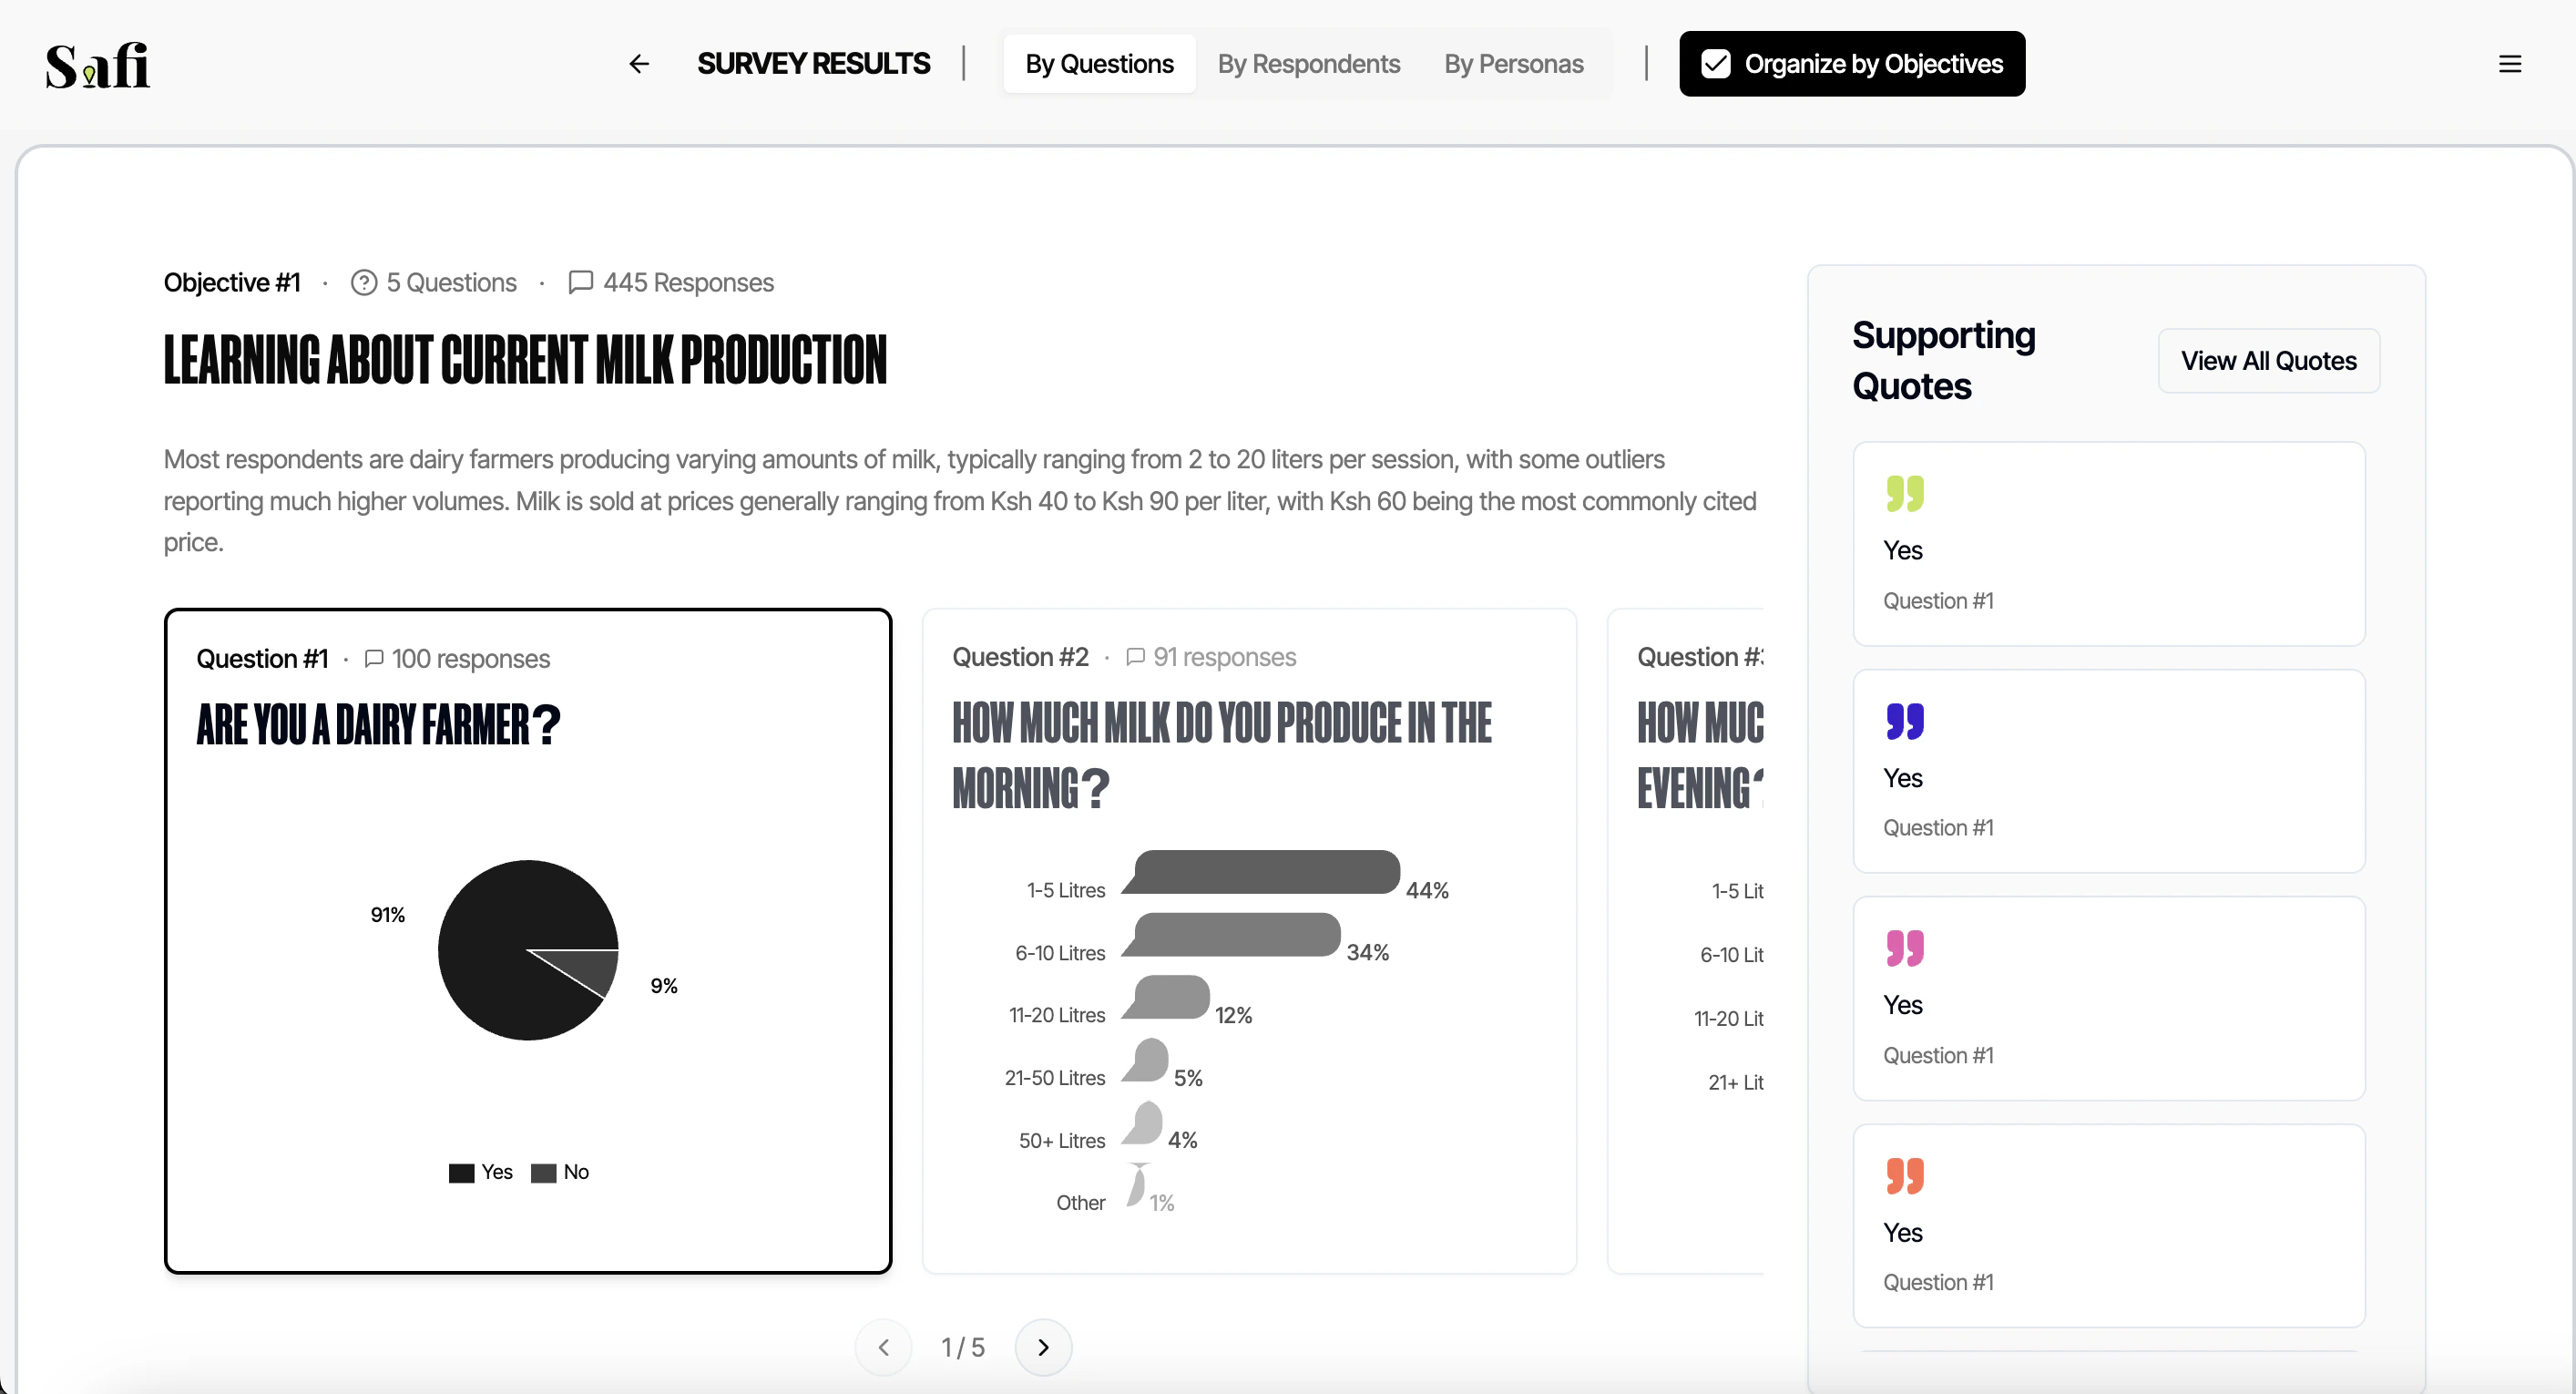 If you assigned objectives during setup, you can toggle to the **Objectives View**. This groups all questions under their objective and shows a summary for each objective as a whole — useful for presenting findings in a structured way.